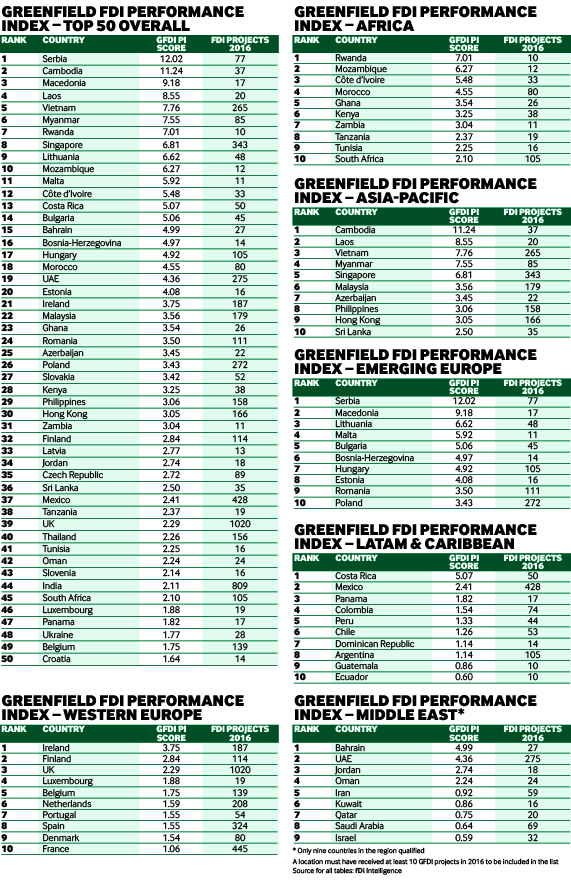
Serbia ranks first in 2016 greenfield FDI Performance Index

Serbia punched 12 times above its weight when it comes to attracting greenfield inward investment in 2016, according to a study by fDi Intelligence. Glenn Barklie reports.
Serbia has topped the 2016 Performance Index for greenfield FDI. The south-eastern European country is ranked number one in the annual study by fDi Intelligence, a Financial Times data division, which looked at inbound greenfield investment in 2016 relative to the size of each country’s economy. Serbia scored 12.02 in the index, closely followed by Cambodia (11.24) in second and Macedonia (9.18) in third.
Greenfield foreign investors announced 77 projects in Serbia in 2016, up from 57 in 2015. More than half (53%) of these projects were manufacturing based. Electronic components and automotive components were the country’s most important sectors for greenfield FDI, followed by real estate and textiles.
In contrast, and an important factor in its high index score, the Serbian economy is exhibiting little growth. In 2015, it contracted by almost 16% in nominal terms and recovered only marginally in 2016, by 1.6%. In 2017, it is expected to contract slightly, by -0.02%.
Quicker processing
Serbia rose seven places to 47th in the World Bank’s 2017 Doing Business report, shortening the time it takes to register a property and deal with construction permits, as well as the overall time taken to register a company.
Of the 94 locations analysed in the 2016 Greenfield FDI Performance Index, 68 had an index score greater than 1, while 26 had a score less than 1. A score of 1 indicates that a country’s share of global inward greenfield FDI matches its relative share of global GDP. A score greater than 1 indicates a larger share than indicated by its GDP and a score of less than 1, a smaller share.
Serbia, with a score of 12.02, is attracting more than 12 times the amount of greenfield FDI that might be expected given the size of its economy.
The index uses a methodology devised by UN trade and development body Unctad for overall FDI, and applies it to only greenfield FDI – excluding mergers and acquisitions, intracompany loans and other forms of crossborder investment.
Of the 10 largest economies in the world, only the UK (2.29), India (2.11) and France (1.06) had index scores above 1. China’s score fell by 0.03 points to 0.37; only Italy (0.37) and Japan (0.22) had equal or lower scores of the 94 countries analysed. The US improved slightly from 0.47 to 0.50.
Regional analysis
Fourteen African countries made the index, of which only Nigeria and Algeria had a score of less than 1. Rwanda topped the African index, outperforming its expected receipts of greenfield FDI sevenfold.
Cambodia topped the Asia-Pacific index, with a score of 11.24. The country received 37 greenfield FDI projects in 2016 worth an estimated $5bn.
Eighteen of the 19 emerging European nations analysed recorded a score of greater than 1. Only Russia, which scored 0.92, fell below the proportional benchmark. Serbia and Macedonia far exceeded their regional counterparts, such as Lithuania, Malta and Bulgaria, who themselves had high index scores.
Costa Rica led the Latin America and Caribbean regional index by some margin. The central American country scored 5.07, while its nearest competitor, Mexico, scored 2.41. Brazil (0.59) ranked bottom of the 11 countries analysed from the region.
Only four of the nine Middle Eastern countries analysed had scores above 1. Bahrain topped the regional index with a score of 4.99, followed by United Arab Emirates (4.36). The number of greenfield FDI projects declined across the Middle East region by 2% in 2016.
Canada and the US both scored below 1, indicating they are larger global players in respect of GDP relative to FDI.
Ireland topped the western European regional index, scoring 3.75. Its economy is firmly based on attracting FDI, primarily from US-based companies. A low rate of corporation tax and skilled workforce are key lures for foreign investors targeting the European market.
Finland and the UK ranked second and third, respectively, in western Europe. The UK performed strongly in FDI terms in 2016 – however it will remain to be seen if this trend continues into the next index when the Brexit process will be in full swing.
Greenfield FDI data used in the index is derived from fDi Markets, and excludes retail investments. The 2016 index was extended to 94 countries, all of which received at least 10 greenfield FDI projects in 2016. The 2015 figures were revised from last year’s index as further project information became available in 2016/17. GDP figures were also revised on more recent data from the IMF.

Global greenfield investment trends
Crossborder investment monitor
|
|
fDi Markets is the only online database tracking crossborder greenfield investment covering all sectors and countries worldwide. It provides real-time monitoring of investment projects, capital investment and job creation with powerful tools to track and profile companies investing overseas.
Corporate location benchmarking tool
fDi Benchmark is the only online tool to benchmark the competitiveness of countries and cities in over 50 sectors. Its comprehensive location data series covers the main cost and quality competitiveness indicators for over 300 locations around the world.
Research report
fDi Intelligence provides customised reports and data research which deliver vital business intelligence to corporations, investment promotion agencies, economic development organisations, consulting firms and research institutions.
Find out more.


